I Let Codex Operate My Homelab
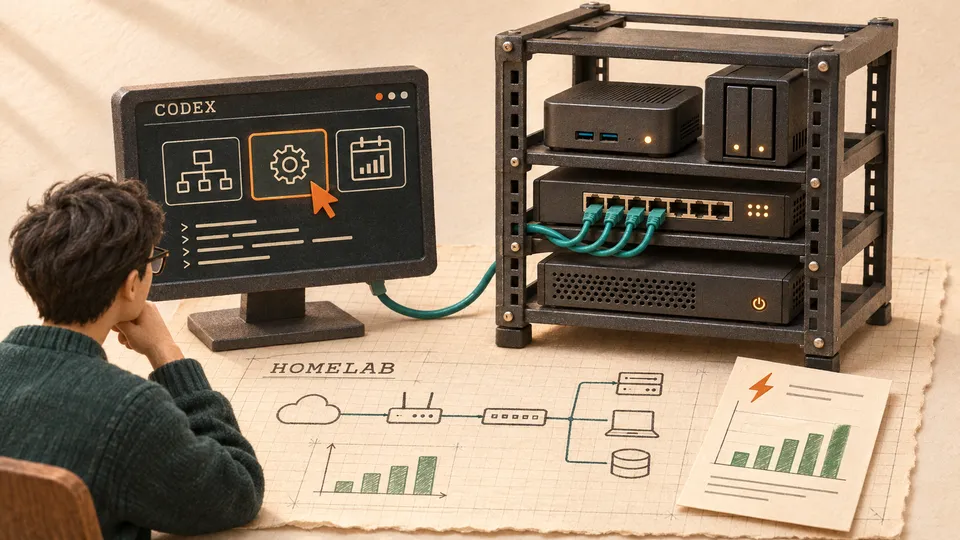
I started by cleaning up my server rack. The hardware and networking equipment had become messy, and I wanted to rearrange things so they would be easier to maintain.
After I powered the equipment back on, I ran into firewall restrictions on the MikroTik. They limited access and prevented me from using an interface directly. I opened Codex to help troubleshoot it.
Roughly three hours later, we had reorganized parts of the network, set up monitoring dashboards, and built a scheduled workflow that sent infographic reports to Discord. Codex had done most of the implementation while I watched, reviewed its plans, and occasionally stopped it.
I hadn't planned that much work when I started moving things around.
From troubleshooting to changing the network
Once we resolved the immediate MikroTik problem, I kept going. The physical cleanup had become a chance to clean up the network configuration too.
I already had an OPNsense-based network, which I described in my previous homelab update. This time, I wanted a dedicated VLAN and interface for IoT devices, and I had an older VLAN I no longer needed. I also wanted to repurpose the MikroTik as a managed switch.
Those changes involved OPNsense, the MikroTik, an access point, and another managed switch. The VLAN configuration had to agree across the devices, and the firewall rules had to match the traffic I intended to allow.
Codex asked about the architecture I wanted. I explained the outcome, then had it inspect the setup and explain its plan before making important changes. As we worked through the devices, I became more comfortable letting it perform the configuration itself.
I still handled critical authentication steps and decided whether the proposed changes made sense.
WinBox, browser pages, and MCP
My preference was to use CLI or MCP wherever they supported the task, then use browser automation or computer use where needed.
| System | How Codex interacted with it |
|---|---|
| OPNsense | MCP, with browser access for operations the available tools couldn't handle |
| MikroTik | Computer use through WinBox, including its terminal |
| Access point and managed switch | Browser-based administration pages |
| Grafana and InfluxDB | MCP and CLI |
For OPNsense, I initially provided access to the web interface and asked Codex to establish an MCP connection. It used that connection where possible and returned to the browser when the available MCP tools didn't cover an operation.
The MikroTik work surprised me more. Codex used WinBox and its built-in terminal through computer use, with me watching. It was smooth enough that I kept handing it the next part of the configuration. I hadn't expected to spend a rack-cleanup session watching an agent operate WinBox.
The access point and the other managed switch had their own browser interfaces. Codex worked through those too. I didn't have to copy its instructions from chat into each administration page myself.
The firewall rule I questioned
During the OPNsense changes, Codex created a firewall rule involving specific IP addresses and ports on an interface I no longer used. I asked it to explain why the rule was there, and we investigated it together. We concluded that it wasn't required.
I stopped it more than once when an action looked unnecessary. During browser and computer-use work, I stayed close enough to follow what it was doing and ask for an explanation. Before important changes, I wanted to understand how the proposed configuration would affect the rest of the network.
That still took attention. I was doing less typing and clicking, but I needed to understand the network well enough to question the changes.
Adding network and electricity dashboards
After the network changes, I asked Codex to work on monitoring. It set up ntopng for visibility into network traffic and device activity, along with a network monitoring dashboard.
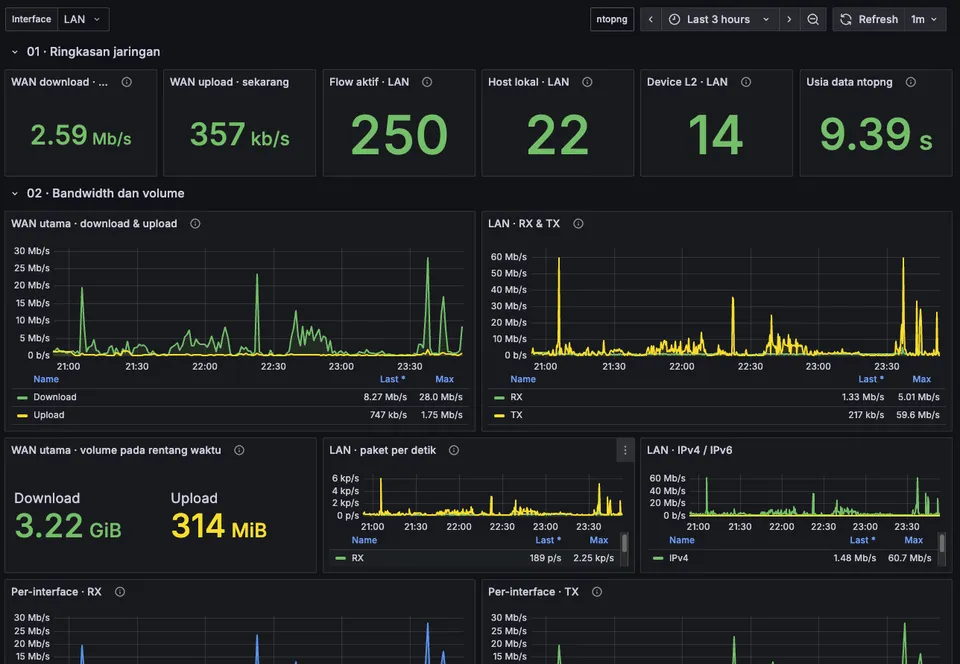 Grafana network dashboard showing WAN bandwidth, active LAN flows, local hosts, and traffic graphs over three hours
The network dashboard in Grafana, with WAN traffic and LAN activity from ntopng.
The electricity dashboard covered my entire home. I connected a Tuya MCB to Home Assistant and sent its electricity readings to InfluxDB, with Grafana displaying the data.
Codex implemented the dashboard through CLI and MCP. I didn't build each panel manually.
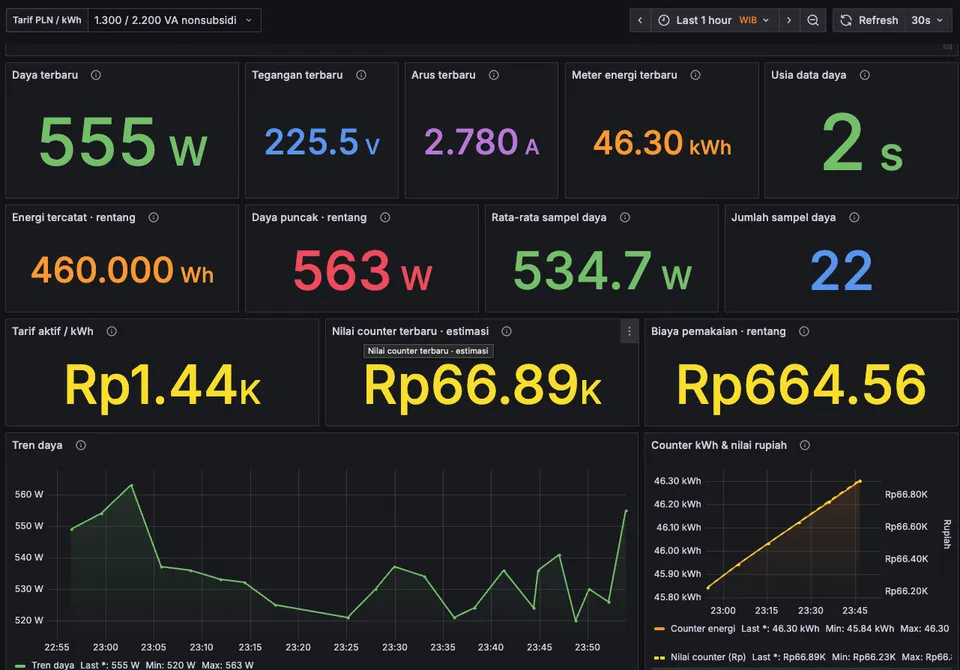 Grafana household electricity dashboard showing power, voltage, current, energy readings, and estimated costs
The household electricity dashboard. Cost estimates use the selected PLN tariff and recorded energy readings.
By the end of the session, both the network and electricity dashboards were working. I then wanted a way to receive summaries without opening the monitoring interfaces each time.
Sending scheduled reports to Discord
Codex helped me build a Windmill workflow that runs on a schedule. An agent in that workflow uses MCP integrations to access dashboard information, produces an infographic summary, and sends it to Discord.
Codex built and configured the automation during our session. The recurring reports run through the separate agent workflow in Windmill afterward.
 Windmill showing upcoming runs for the weekly electricity report and daily network summary
The next scheduled runs in Windmill for the weekly electricity report and daily network summary.
I could check the summaries alongside my messages and open Grafana when I wanted to look more closely.
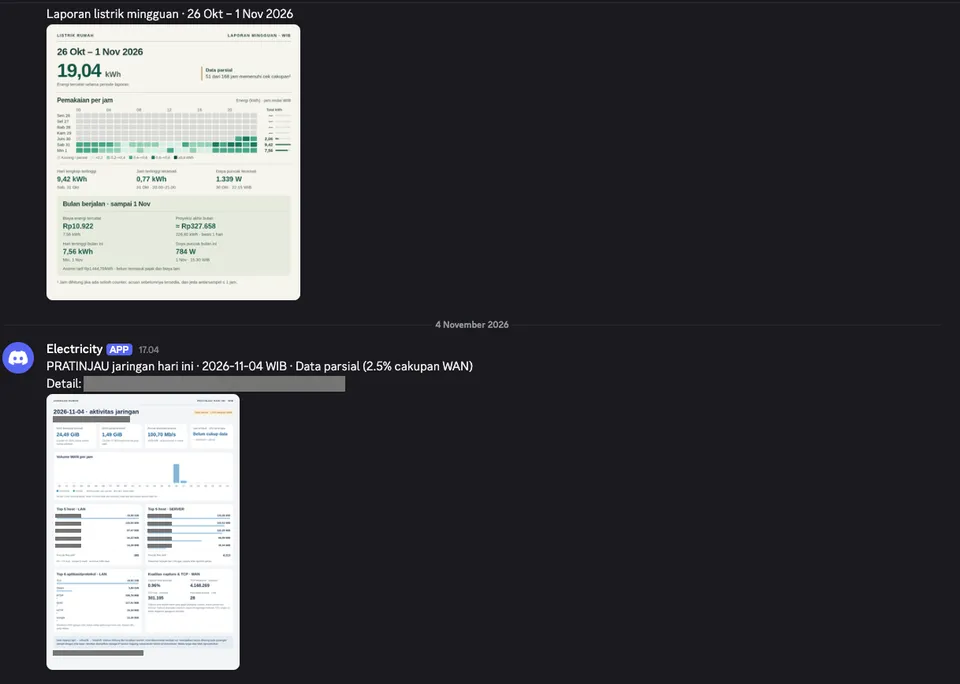 Discord showing a weekly household electricity report and a network report preview, with internal network details redacted
Reports delivered to Discord. Both examples flag partial data; the network report here is a preview. Internal addresses and dashboard links are redacted.
About three hours, with me still watching
My estimate is that Codex handled around 90% of the hands-on implementation across the session. I didn't measure tool calls or time each operation, so I wouldn't use that number as a productivity benchmark. I was present throughout, explaining what I wanted, reviewing plans, handling authentication, and interrupting questionable actions.
The whole session took roughly three hours, with no major incident. The updated network, dashboards, and reporting workflow were working at the end, though I hadn't yet measured their longer-term reliability.
For the next network change, I'd use the same approach: have Codex inspect the setup, explain the plan, and carry out the changes while I review them.