My Home Server Update: Building More, Maintaining Less
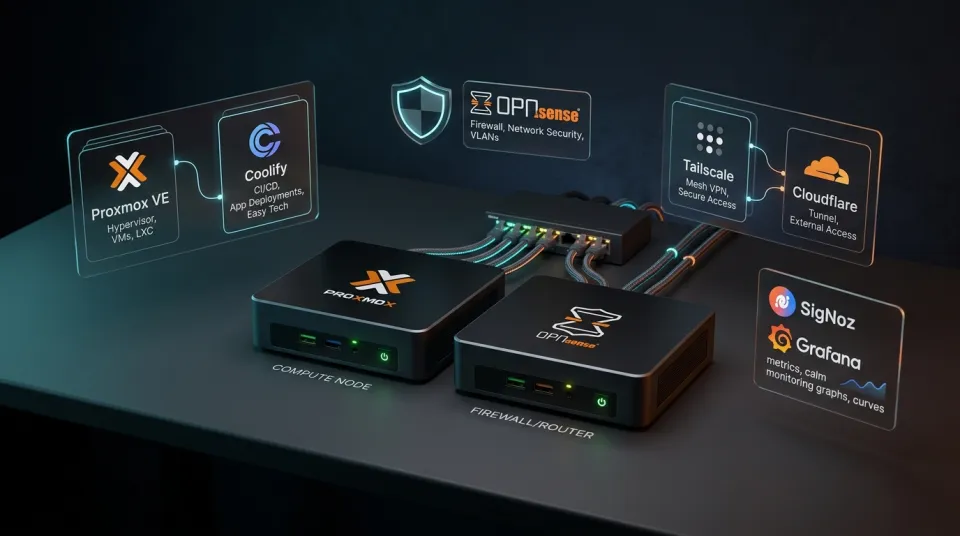
Table of Contents
- The quiet shift in how I use my homelab
- The hardware: barely changed, slightly rearranged
- The networking upgrade: OPNsense and real isolation
- Visualizing the architecture: traffic and boundaries
- Workload strategy: pragmatic over dogmatic
- What stays running today
- Observability without tool sprawl
- Coolify vs. Jenkins: the deployment turning point
- Some experiments were meant to stay experiments
- The AI homelab is not about running local models
- When things broke (and the truth about backups)
- The DIY UPS is still holding on
- The operating philosophy: does this deserve to stay running?
- Three lessons from a year of homelabbing
The physical server has barely changed, but the way I use and maintain it has.
Roughly a year ago, I wrote about why I built a home server. Back then, I was focused on escaping cloud bills, learning Proxmox, and building a low-cost sandbox where I could experiment freely without watching an hourly meter tick upward.
A year later, that machine is still running my core services: personal applications, automation pipelines, observability, local experiments, storage, and the infrastructure supporting my AI workflows.
Yet if you look at how I interact with it day to day, my approach has shifted significantly.
In the beginning, I was enthusiastic about deploying complex enterprise patterns just to see if I could make them work. Today, I am far more selective. I still love experimenting, but when it comes to permanent infrastructure, my priority is software that solves recurring problems without requiring constant maintenance.
Not every experiment needs to become permanent infrastructure. Learning how a complex system works is valuable; having to patch, debug, and monitor it indefinitely when it does not solve an actual problem is not.
1 · The hardware: barely changed, slightly rearranged
The core compute node is almost identical to the machine from last year:
- Primary Hypervisor: Intel Core i5-10400 (6 cores, 12 threads)
- Memory: 32 GB DDR4 RAM
- Primary Storage: 1 TB NVMe SSD
- Base OS: Proxmox VE
For a single-node homelab running mostly Linux containers and lightweight services, this setup has plenty of headroom. CPU utilization rarely spikes unless I am compiling code or running heavy batch ingestion, and 32 GB of RAM has proven to be the sweet spot for dozens of concurrent services.
The only meaningful physical addition over the past year has been on the networking side:
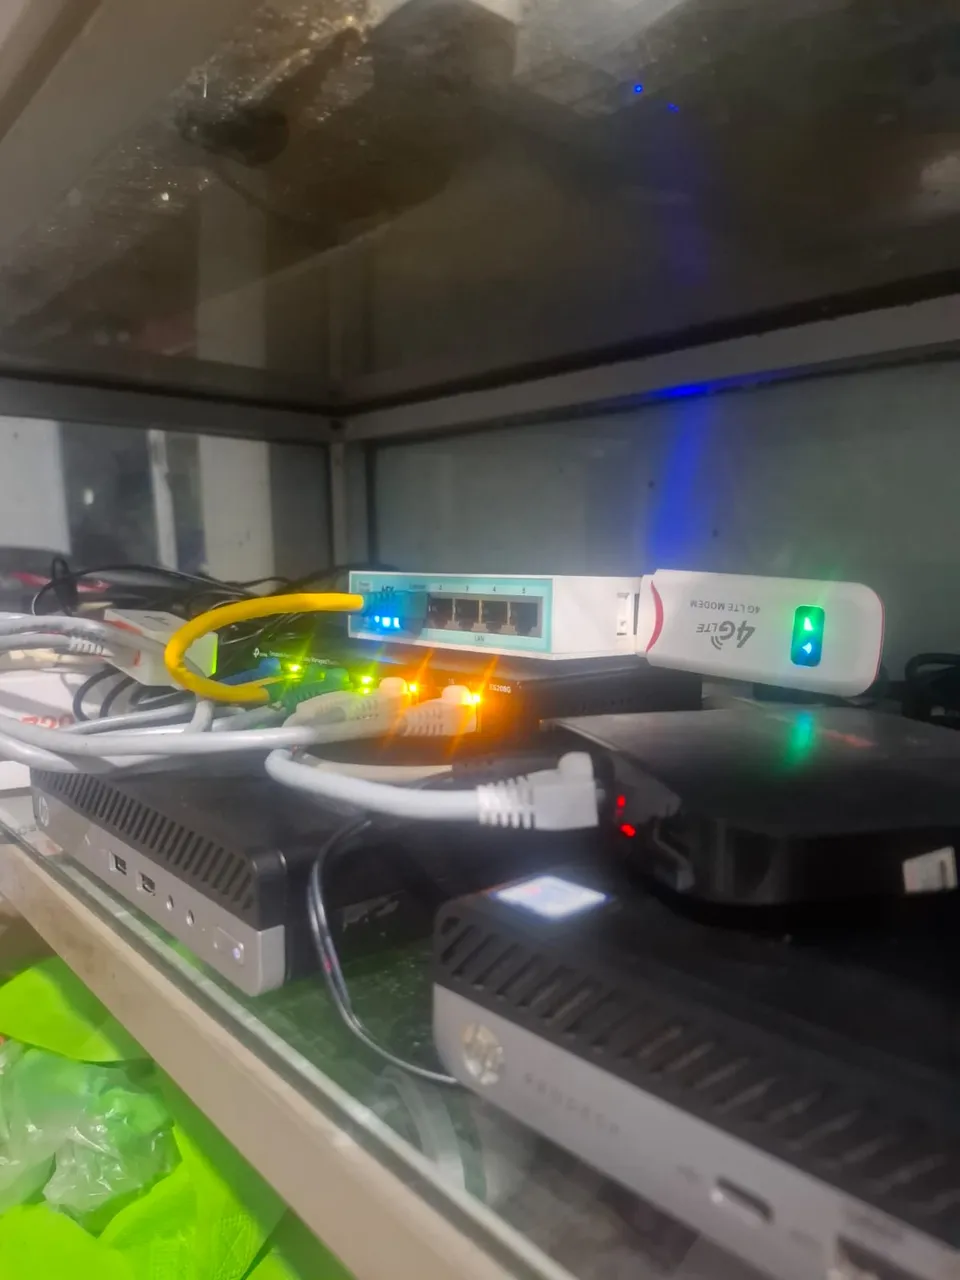
- Dedicated Firewall/Router: Mini PC with an Intel Core i3 (7th Gen), 8 GB RAM, and a 128 GB NVMe running OPNsense bare metal.
- MikroTik Router/Switch: Retained for switching, network experiments, isolated hotspot tests, and routing specific shared networks.
- Dual NICs: Added a USB-to-Ethernet adapter to the primary Proxmox node after an elusive connectivity issue (more on that later).
Separating routing and firewalling from the main hypervisor onto dedicated hardware was one of the best physical decisions I made. It meant that rebooting Proxmox or breaking a bridge configuration would no longer take down the household internet.
2 · The networking upgrade: OPNsense and real isolation
When I first started, my network was relatively flat. As I added more services (some public, some internal, and others experimental), I needed real boundaries.
Today, all traffic flows through the dedicated OPNsense appliance before hitting a managed switch:
Internet (WAN)
    └──> OPNsense Router/Firewall (Bare Metal Mini PC)
            └──> Managed Switch
                    ├──> Home LAN (Personal devices, laptops, phones)
                    ├──> Server Network (Proxmox hypervisor & workloads)
                    └──> Shared / Guest Network (Isolated external network)
The network is logically segmented into three distinct VLANs:
- Home LAN: Trusted daily driver devices (laptops, mobile phones, IoT).
- Server Network: Proxmox, LXC containers, virtual machines, and backend services.
- Shared Network: An isolated network enabled occasionally for guests or external devices, strictly blocked from accessing home or server subnets.
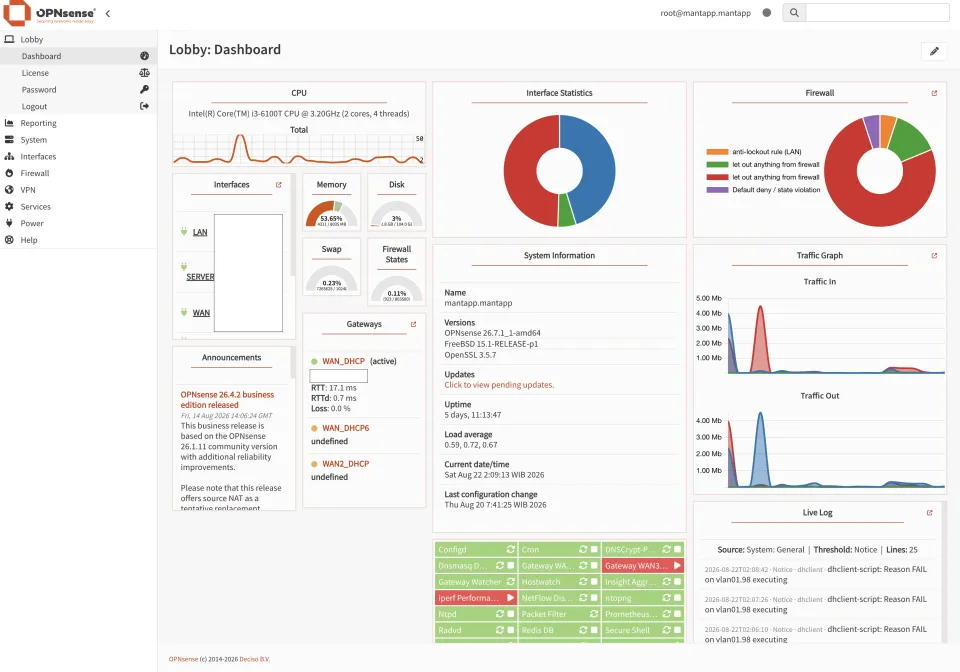 OPNsense dashboard showing system statistics, traffic graphs, and firewall state
When I first installed OPNsense, my primary motivation was exploring VPN protocols and gateway routing. Over time, my focus shifted entirely toward firewalling, automated segmentation, DNS visibility, and security.
OPNsense currently handles:
- Stateful Firewalling & Inter-VLAN Routing: Strict rules determining which subnets can communicate with specific server ports.
- Unbound DNS & DNS over HTTPS (DoH): Fast, cached local resolution with encrypted upstream queries.
- DHCP & Static Leases: Predictable address assignments for physical and virtual interfaces.
- Gateway Groups & Traffic Monitoring: Real-time visibility into bandwidth consumption and interface health.
Having a dedicated network layer turned the homelab into a structured environment where experiments stay contained.
3 · Visualizing the architecture: traffic and boundaries
To understand how workloads connect internally and externally, it helps to look at the logical layout:
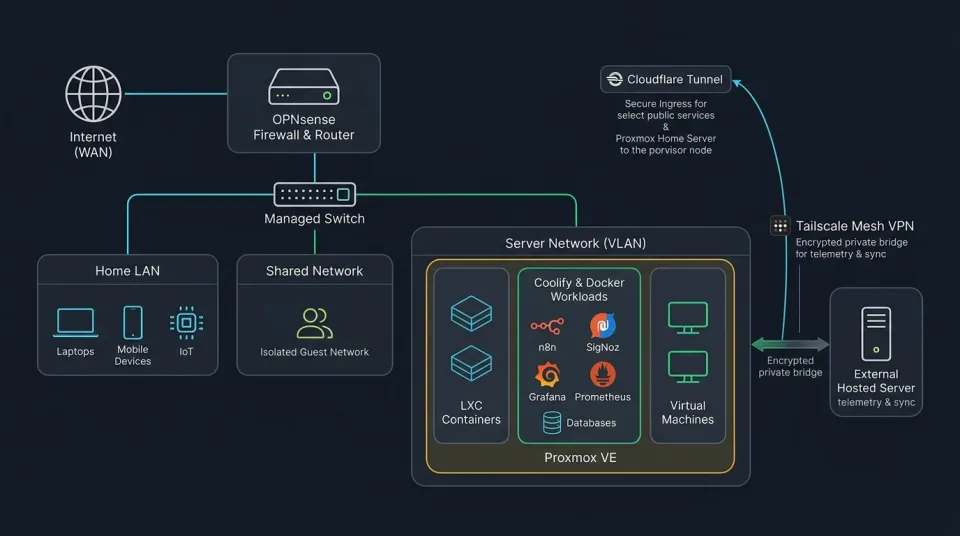 Home server network topology diagram showing OPNsense, managed switch, VLANs, Proxmox VE, Cloudflare Tunnel, and Tailscale mesh VPN
Ingress and Access Strategy
- Local Domain Routing (
*.home):
Nginx Proxy Manager handles local reverse proxy duties. Internal dashboards and services resolve to private*.homedomains with local SSL certificates, accessible only within authorized VLANs. - Public Ingress via Cloudflare Tunnel:
For the few services that need public access, traffic routes through Cloudflare Tunnels directly to the target container. No open inbound ports on the WAN interface, no port forwarding rules, and no exposing the public IP. - Mesh Connectivity with Tailscale:
Tailscale connects my trusted client devices and an external hosted VPS to the home network. This creates an encrypted private mesh between cloud infrastructure and the home server without exposing management ports to the public internet.
A practical example: lightweight agent runtimes and scraping workers running on an external cloud VPS send their telemetry, metrics, and application traces back to SigNoz and PostgreSQL running inside my home server over Tailscale. The external node gets cloud uptime; the homelab handles long-term storage and observability without opening firewall holes.
4 · Workload strategy: pragmatic over dogmatic
There are plenty of opinions on the best runtime format for self-hosting: bare metal, LXC containers, full virtual machines, or Kubernetes clusters.
I have come to view those debates as mostly academic. In practice, I use whatever runtime fits the operational requirements of the tool:
- LXC Containers: Used for stateful services and foundational databases (PostgreSQL, Redis, RabbitMQ, MongoDB, Nginx Proxy Manager). They offer near-zero overhead, instant start times, and direct filesystem visibility.
- Docker via Coolify: Used for application stacks, automation workflows (n8n), custom Node/Python microservices, and internal tooling.
- Virtual Machines: Reserved for workloads requiring strict kernel isolation, custom OS distributions, or dedicated network stacks (such as isolated router testing).
I choose the runtime based on operational requirements rather than architectural purity.
5 · What stays running today
Over the past year, I audited my containers and removed services that were running without a clear daily use case.
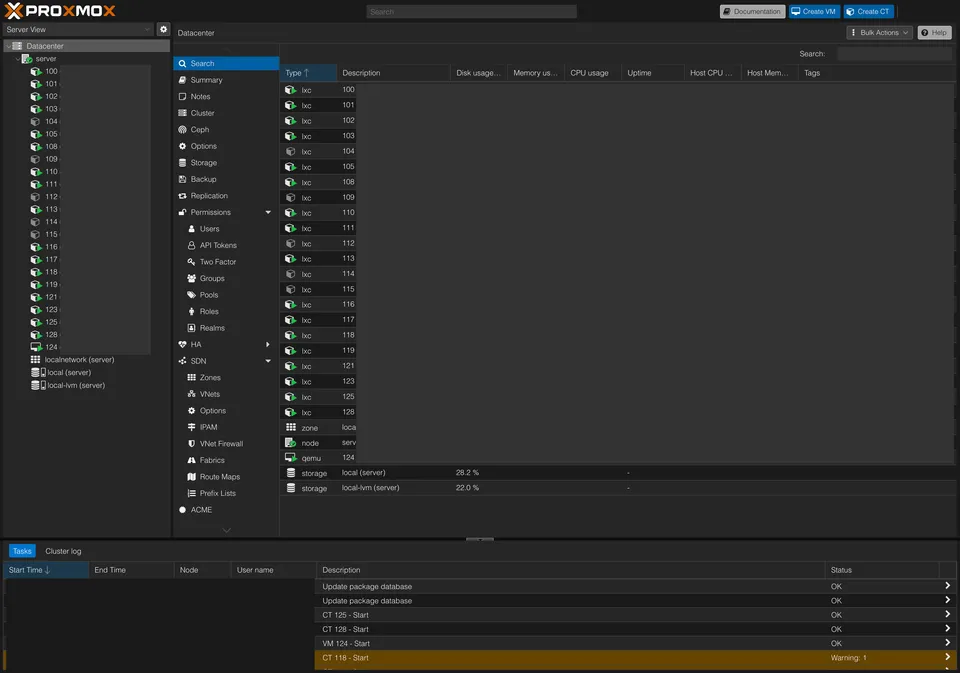 Proxmox VE dashboard showing active LXC containers, virtual machines, and resource allocations
The core services that run 24/7 today include:
- Deployment & PaaS: Coolify
- Workflow Automation: n8n, OpenClaw agent runtime
- Observability: SigNoz, Grafana, Prometheus, InfluxDB
- Data Stores: PostgreSQL, MongoDB, Redis, RabbitMQ
- Networking & Ingress: Nginx Proxy Manager, Cloudflare Tunnel connector, Tailscale daemon
- Recreation: Crafty Controller (Minecraft server for friends)
Several containers in the Proxmox list are currently stopped. I keep them around because stopped LXCs consume virtually zero CPU and RAM, preserve valuable configuration notes, and can be spun up in seconds if I want to revisit an experiment.
6 · Observability without tool sprawl
Observability remains one of my favorite parts of running a homelab, but my stack has sharpened. Rather than trying to make one tool do everything or running five redundant dashboards, each component has a defined role:
- Prometheus: Scrapes system metrics, node exporters, and hardware telemetry across the hypervisor and containers.
- Grafana: The primary visual layer for high-level system dashboards, network throughput, and real-time power tracking.
- InfluxDB: Stores time-series data from IoT sensors, specifically household electricity monitoring via ESP32 and PZEM modules.
- SigNoz: Provides distributed tracing and OpenTelemetry ingestion, collecting spans and traces from n8n automation pipelines and backend services.
I previously ran Zabbix to learn its trigger system and agent architecture. While it is a capable monitoring platform, the template management and maintenance overhead outweighed its utility for a single-node setup. Once Prometheus and Grafana covered my metrics and alerting, I decommissioned Zabbix.
7 · Coolify vs. Jenkins: the deployment turning point
The biggest operational upgrade this year was switching to Coolify.
Previously, I managed deployments using a self-hosted Jenkins instance with Pipeline as Code and declarative Jenkinsfiles.
The Jenkins Workflow:
Git Commit → Webhook → Jenkins Master → Provision Agent → Docker Build → Credential Injection → Deployment Script
Jenkins taught me a lot about CI/CD mechanics, pipeline syntax, credential scoping, and build container orchestration. But as a solo operator, using Jenkins for small personal projects meant that every new deployment required maintaining Jenkins itself: updating plugins, handling Java runtime versions, managing pipeline scripts, debugging runner permissions, and ensuring workspace cleanup.
I spent more time maintaining the deployment engine than writing software.
With Coolify, the deployment flow collapsed into something effortless:
The Coolify Workflow:
Git Push → Automatic Buildpack / Dockerfile Build → Live Deployment
Coolify handles container lifecycles, environment variables, reverse proxy integration, and automated rollouts directly from GitHub pushes.
Jenkins makes sense for multi-team enterprise environments with dedicated DevOps support. For a personal homelab, its maintenance model was overkill. Coolify let me get back to building features instead of tending pipelines.
8 · Some experiments were meant to stay experiments
Building a complex system to understand how it works is valuable, but that doesn't mean you need to maintain it indefinitely once you understand the architecture.
The PostgreSQL High Availability Experiment
A clear example was my experiment with a high-availability PostgreSQL cluster using Patroni, etcd, and PgBouncer:
- Three distributed PostgreSQL nodes managed by Patroni.
- A three-node etcd cluster for distributed consensus and leader election.
- PgBouncer for client connection pooling and automatic failover routing.
Setting it up was a great exercise: I simulated split-brain scenarios, triggered leader elections, and tested etcd quorum.
However, my entire homelab runs on a single physical machine.
Running three database instances and three consensus nodes inside virtualized containers on a single physical motherboard provided zero real hardware redundancy. If the NVMe drive died or the power cut out, all three nodes went down together. Meanwhile, I was spending hours monitoring cluster health, debugging etcd heartbeats, and handling synchronization states.
I tore down the cluster and replaced it with a single PostgreSQL LXC container, freeing up RAM and CPU while keeping the knowledge gained from configuring HA systems.
Production patterns are worth learning without needing to stay running in a home environment.
9 · The AI homelab is not about running local models
A lot of homelab discussions focus on clustering GPUs for local model inference.
My setup takes a different approach: I do not run local model inference on this hardware.
An Intel i5-10400 without a dedicated GPU cannot deliver practical token throughput for modern models. Hosted APIs offer strong reasoning capabilities at low cost, especially when paired with sensible caching and budget limits.
Instead, my home server hosts the surrounding systems:
- Agent Runtimes: Running OpenClaw as my personal AI operating layer, coordinating tasks, memory, and scheduled operations.
- Workflow Automation: Complex multi-step reasoning pipelines orchestrated in n8n.
- Context & Storage: Vector caches, relational databases, and log sinks for agent history.
- Observability: Tracking token usage, API latency, and tracing agent tool calls via SigNoz.
Instead of investing in GPU hardware, I use the server to host the state, orchestration, and tooling that make AI workflows useful day to day.
10 · When things broke (and the truth about backups)
Things broke along the way, sometimes causing real downtime.
The NVMe Incident
During a period of heavy I/O combined with an extended power outage that drained the battery backup, my 1 TB NVMe drive suddenly stopped mounting. Proxmox could no longer read the partition table, and the boot sequence hung.
After pulling the drive and performing a complete low-level format, the hardware functioned normally again, suggesting a severe filesystem or partition corruption rather than physical NAND failure.
Regardless of the root cause, all container data on that drive was lost.
Missing Backups
The biggest gap in my setup is the lack of an automated 3-2-1 backup pipeline.
A proper backup architecture is straightforward in theory: Proxmox Backup Server (PBS) on a secondary node, encrypted incremental snapshots, and deduplicated offsite sync. Rebuilding my core containers after the NVMe failure was a clear reminder that manual export scripts are not a substitute for automated backups. Setting up a dedicated backup target is my next infrastructure priority.
The Proxmox Command Mistake
In another instance, while experimenting with Proxmox cluster configurations late in the evening, I ran a destructive storage cleanup command targeting the wrong volume group. Several LXC configurations were erased instantly. There was no clever recovery command; I had to recreate the containers from scratch.
The Mystery Network Disconnect
A few months ago, the server completely disappeared from the local network.
Pings failed, SSH timed out, and web dashboards were unreachable. Yet when I plugged in an external HDMI monitor, the Proxmox console was responsive and showed no kernel panics. Rebooting would temporarily restore connectivity for an hour or two before the interface dropped carrier signal again.
After two days of troubleshooting kernel modules and switch ports, I added a USB 3.0 Gigabit Ethernet adapter to the mini PC. The connection stabilized immediately. The onboard Realtek NIC is still assigned to secondary tasks, but primary traffic now routes through the external interface.
11 · The DIY UPS is still holding on
The modified uninterruptible power supply from my previous post, combining a standard inverter with an external automotive lead-acid battery, is still providing backup power.
 DIY UPS setup with car battery and inverter powering the home server
The trade-offs remain unchanged:
- The Pros: It delivers between 6 to 8 hours of continuous runtime during PLN grid outages, costing a fraction of an equivalent enterprise lithium-ion rackmount battery.
- The Cons: It requires ongoing manual inspection. Lead-acid batteries degrade, electrolyte levels need checking, and if an outage outlasts the capacity, the system experiences a hard shutdown (which contributed to the NVMe corruption described earlier).
My monthly electricity cost for the entire setup remains between 70,000 to 120,000 IDR (~$4.50 to $7.50 USD), tracked continuously via InfluxDB and Grafana. For a 24/7 private cloud, the operational economics continue to justify the hardware.
12 · The operating philosophy: does this deserve to stay running?
Every running service carries an ongoing maintenance tax: updates, potential breakage, backups, and mental overhead. The electricity and RAM costs are minor, but having a dozen non-essential services running creates constant maintenance friction during routine upgrades.
Whenever an experiment succeeds, I ask one question:
Does this service solve a recurring problem, or was it just an interesting experiment?
If it was just for learning, I document the configuration, turn off the container, and move on. Mature, stable tools dominate my current setup:
- Coolify instead of custom Kubernetes manifests.
- Tailscale instead of manual mesh routing tables.
- Cloudflare Tunnels instead of complex DMZ ingress architectures.
- OPNsense instead of maintaining raw iptables scripts.
- Managed PostgreSQL & Redis LXCs instead of distributed HA clusters.
These tools work consistently without requiring weekend maintenance.
13 · Three lessons from a year of homelabbing
1. Low-maintenance software is a feature
Prioritize operational simplicity over raw flexibility for permanent infrastructure. A tool that handles 80% of what you need with zero upkeep is often better than a complex system requiring weekly maintenance.
2. Network isolation enables safer experimentation
Putting servers on dedicated VLANs behind a firewall changes how you test. Knowing that a broken container cannot touch personal devices or take down household internet makes experimenting much less risky.
3. Learn production patterns, then deploy what fits
Configuring HA clusters and complex monitoring stacks is great for learning systems engineering. But recognizing when those patterns are unnecessary for a single-node homelab keeps your infrastructure manageable.
Wrapping Up
The server hardware itself has not changed drastically over the past year: it remains a compact mini PC running Proxmox. The real improvement came from streamlining the software stack, isolating network zones, and maintaining only the services that provide consistent daily utility.