I Didn't Need More AI Logs. I Needed to Know Where My Agent Was Struggling.
Table of Contents
- Why Normal Logging Didn't Feel Right
- Two Agents, Two Very Different Workloads
- From Logs to Traces
- Token Usage Isn't Always Where I Expected
- A Trace Is More Useful Than a Giant Debug Log
- I Still Don't Trace Everything
- Observability Should Never Break the Agent
- Observability Doesn't Tell Me Whether the Answer Is Good
- What Changed for Me
The final response only told me what happened at the end, not what happened along the way.
My AI agents worked well enough for basic demos: they answered questions, retrieved information, and called tools when asked. But once I put them to work on actual tasks, debugging them became frustrating.
A response would fail or wander off track, and the output gave me zero clues about where things broke down. Latency would spike unpredictably, token counts would jump without an obvious reason, or the agent would loop through file reads and tool calls before finally returning an answer.
Standard application logs only told me how the run ended, not what happened along the way. Adding more unstructured text logs was not helping; I needed visibility into where the agent was actually getting stuck.
Why Normal Logging Didn't Feel Right
My first thought was to log everything: every model call, tool invocation, argument payload, return value, and duration:
request → model → tool → model → tool → tool → model → response
Technically that works, but agent execution gets messy fast. A single request can spin off multiple LLM calls, retries, database queries, file reads, and nested tool calls. Dumping all of that into standard application logs generates noisy, unformatted walls of text. Grepping through logs by request ID to manually stitch together an execution tree felt like an extra chore just to start debugging.
I wanted a clean timeline where I could open a single execution and immediately see:
- Total run duration and step latency
- Token consumption per LLM call
- The sequence and frequency of tool calls
- The session or request context
- The exact point of failure when an error occurred
That shift in perspective is what pushed me toward agent tracing.
Two Agents, Two Very Different Workloads
I currently run observability for two agents with very different workloads.
The first is my portfolio agent, which answers questions about my projects, background, and blog posts. Its execution path is straightforward and predictable:
request → agent → model → portfolio tool → model → response
A user query might trigger a project lookup or an experience search before the model synthesizes the final reply.
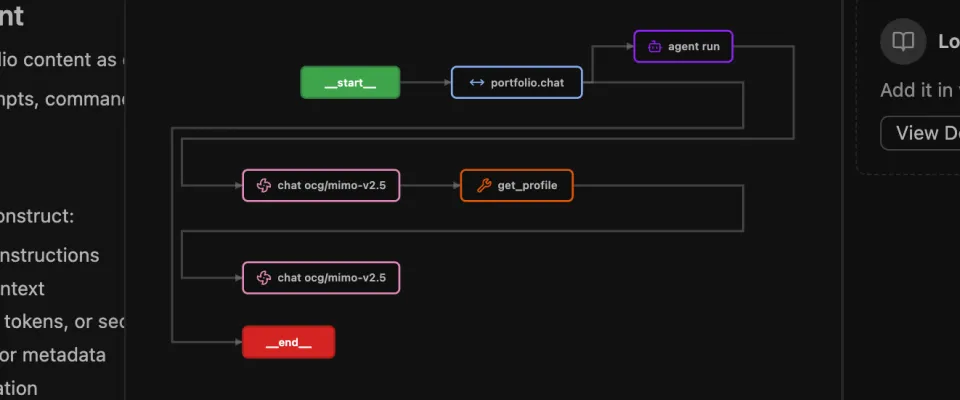 Langfuse trace graph illustrating the step-by-step execution path and tool calls of the portfolio agent
The second agent is far more dynamic: an internal support and troubleshooting assistant built around OpenCode. It inspects repositories, reads files, runs searches, and calls MCP tools to pull context:
question → model → search → read file → read file → MCP → model → another search → another tool → response
When an execution like this takes 30 seconds, looking only at the final output tells you nothing useful. Was the model generating slowly? Did an MCP tool hang? Did the agent run an overly broad search or repeatedly read the same file? Did it blow through its context window carrying massive tool payloads?
Without traces, all of these failure modes produce the exact same symptom: a slow response.
From Logs to Traces
I set up OpenTelemetry for instrumentation and Langfuse for trace visualization and inspection. Keeping the instrumentation separated via OpenTelemetry ensures the agents aren't tightly coupled to a single vendor or tool:
AI Agent → OpenTelemetry → Langfuse
For the portfolio agent, each user interaction generates a trace encompassing the model calls and retrieval operations. For the support agent, OpenCode exports telemetry natively over OpenTelemetry, giving me clear visibility across multi-step tool executions.
I keep the captured telemetry scoped to a few essential attributes:
- Tool spans and execution timing
- Prompt and completion token usage
- Model names and latency per span
- Session and conversation identifiers
- Error states and exceptions
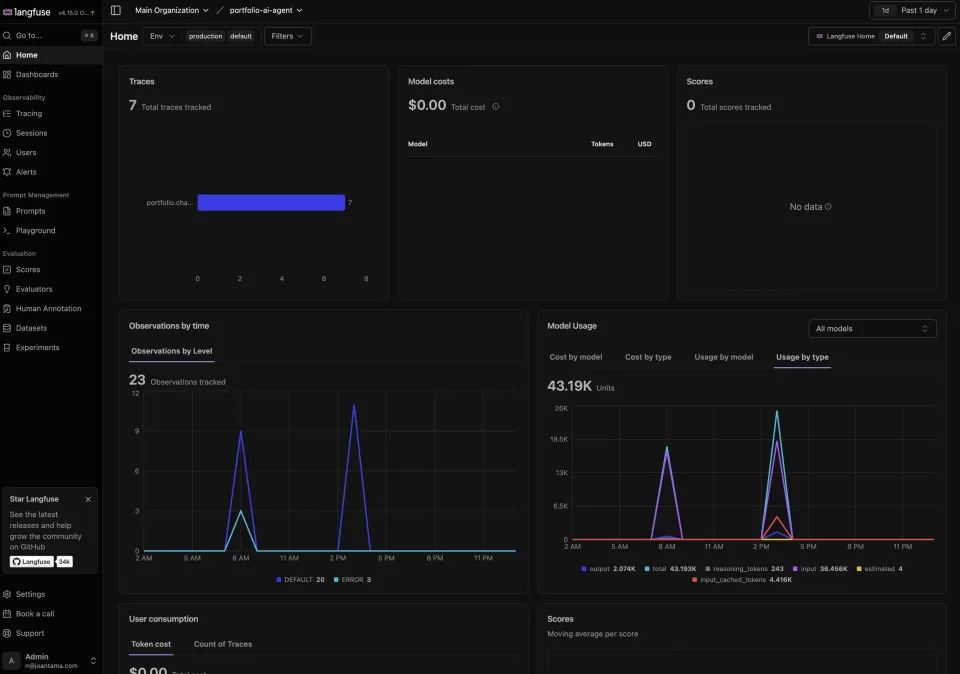 Langfuse observability dashboard tracking traces, observations, token breakdown, and error levels
This structure removes the guesswork from performance debugging. Instead of treating a slow run as an undifferentiated black box ("the AI was slow"), I can pinpoint whether latency came from model inference or an external tool call. Instead of just noting an expensive request, I can see which tool payload caused the prompt size to swell.
Token Usage Isn't Always Where I Expected
I initially assumed conversation history was the main driver of high token consumption. Long chat histories obviously inflate context, but with tool-heavy agents, tool output is often the bigger factor.
When an agent retrieves an entire source file or a large database query result, that content gets appended to the prompt for subsequent model calls. If the agent calls retrieval tools several times in a single turn, the context window compounds rapidly.
Tracing makes this behavior obvious. For instance, seeing ten consecutive file reads in a support agent trace is not necessarily an error if the task required inspecting multiple files. But it gives me a clear starting point: I can see whether the agent got trapped in a repetitive loop, retrieved redundant files, or pulled in full file contents when a targeted search would have sufficed.
A Trace Is More Useful Than a Giant Debug Log
The primary value of structured tracing over raw text logs is hierarchy. A trace represents a bounded execution: nested operations belong to specific spans, tool calls show exact execution sequences, latency maps directly to individual operations, and errors point to the exact step where a failure occurred.
This shifts the mental model of AI debugging away from reading monolithic chat transcripts and closer to debugging distributed microservices. Once an agent coordinates multiple tools, APIs, and retrieval sources:
prompt → response
evolves into a small distributed workflow with discrete state transitions and independent failure points. Tracing gives you the visibility needed to understand those moving parts.
I Still Don't Trace Everything
Collecting detailed telemetry comes with an obvious risk: inadvertently logging sensitive data. This is especially relevant for support agents that interact with internal repositories, databases, or environment configs.
I keep a straightforward boundary: capture operational metadata, not raw sensitive payloads. I want to know which tool was executed, how long it took, whether it succeeded, and basic operational attributes (like file paths or query types). Storing the full contents of proprietary files or internal database rows in an external trace store is unnecessary for performance debugging and creates an avoidable security footprint.
Before adding new attributes or spans, I evaluate whether the debugging value justifies storing that specific data.
Observability Should Never Break the Agent
Another core principle is keeping telemetry strictly off the critical execution path. If Langfuse is unreachable or trace exporter buffers fill up, the agent must continue serving user requests without interruption:
Langfuse unavailable ≠ agent unavailable
Trace exports should always be non-blocking and asynchronous. Losing visibility into a single run during a monitoring hiccup is inconvenient, but letting a monitoring failure crash user-facing functionality would be a design mistake. This is standard practice in backend engineering, and agent systems should follow the same rule.
Observability Doesn't Tell Me Whether the Answer Is Good
Observability provides operational clarity, but it does not evaluate answer quality. A clean, low-latency trace can still return an incorrect answer, while a long, tool-heavy trace might be exactly what a complex problem required.
I treat observability and evaluation as two distinct layers:
- Observability answers operational questions: latency, token usage, tool call sequences, and execution errors.
- Evaluation measures output quality: factual correctness, retrieval precision, prompt effectiveness, and task completion.
Having good telemetry is the foundation because it shows how the system operates, but evaluating whether the output is actually helpful requires dedicated testing and evaluation pipelines.
What Changed for Me
Before instrumenting my agents, debugging always started from symptoms: high latency, token spikes, or vague quality issues. Without intermediate data, figuring out what went wrong meant guessing.
With traces in place, I can inspect the exact execution sequence: the order of tool calls, individual span latencies, token breakdown, and error locations. It doesn't automatically fix bugs, but it replaces guesswork with concrete execution data. Whether the fix involves pruning tool payloads, refining system prompts, or caching frequent lookups, I now know where to focus.